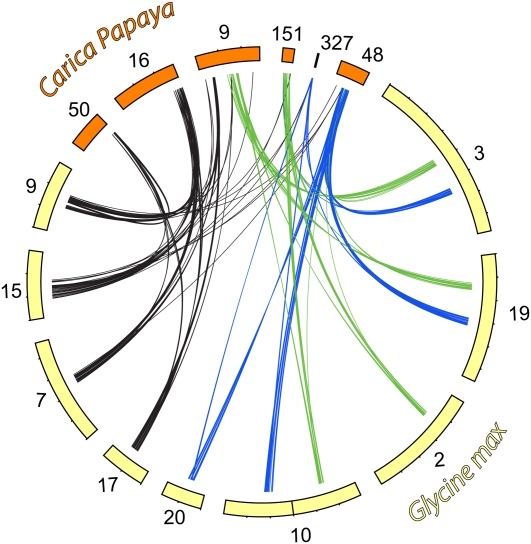
Figure 4.
Orthologous Segments between Soybean and Papaya.
Circos plot of the segments conserved between soybean (yellow) and papaya (orange). Curved lines represent top BLAST hits that mapped from soybean to papaya. Segments of the genome that arose from the Gamma-hexaploid lineages are colored black, green, and blue.

