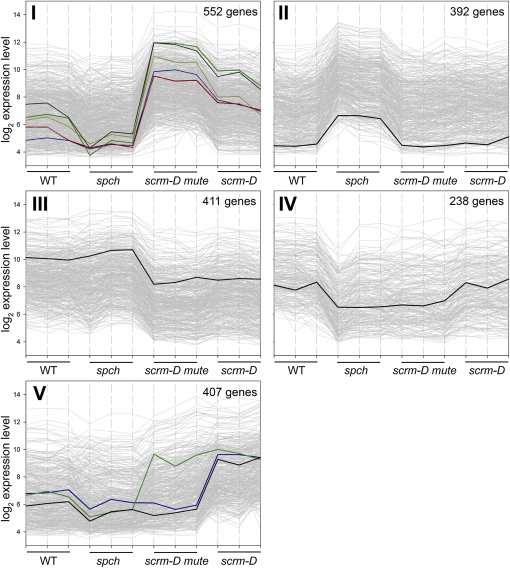
Figure 2.
K-Means Clustering of Genes Showing Differential Expression in Stomatal Differentiation Mutants.
The log2 expression levels are plotted against the three replicates of each genotype (the wild type, spch, scrm-D mute, and scrm-D). Genes were prefiltered using the variance filter implemented in the MeV software to yield the 2000 genes showing highest variance across the 12 arrays. Cluster I: genes upregulated in scrm-D mute and to a lesser extent in scrm-D (meristemoid and GMC/GC enriched, respectively). Black, TMM; green, EPF2; red, ARR16; blue, CLE9; yellow, POLAR (At4g31805). WT, wild type. Cluster II: genes upregulated in spch (pavement cell–only epidermis). Highlighted in black is a representative gene (Orp4C, At5g57240) of this cluster. Cluster III: genes with reduced expression in scrm-D mute and scrm-D. Highlighted in black is IAA7 (At3g23050), which shows the representative expression pattern in this cluster. Cluster IV: genes expressed most strongly in the wild type and scrm-D. Highlighted in black is a representative gene (integral membrane family protein, At5g44550) of this cluster. Cluster V: genes upregulated in scrm-D (GMC/GC-enriched). Black, CHX20, a cation/H+ exchanger of GCs; blue, FAMA; green, EPF1.

