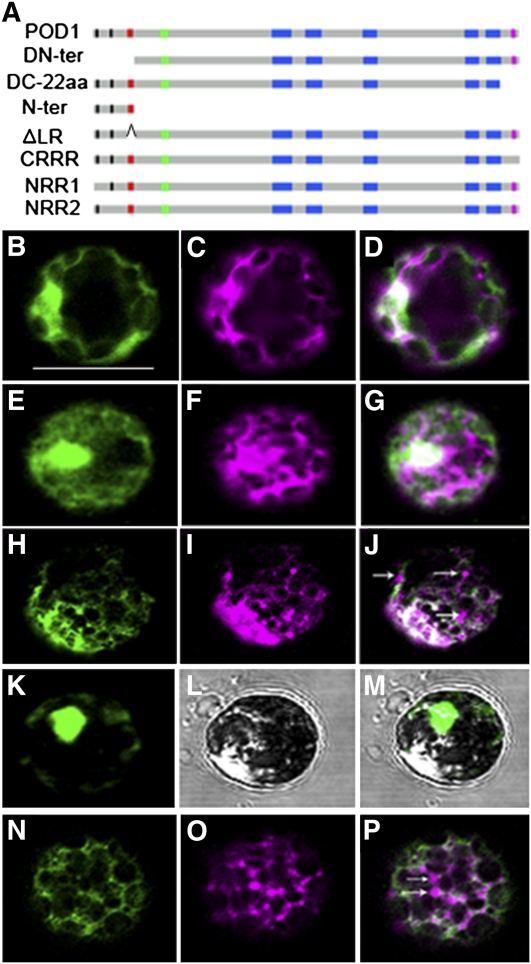
Figure 6.
Mutation Analysis of POD1.
(A) A diagram showing different mutations and deletions of POD1 protein for POD1-GFP fusion constructs. aa, amino acids.
(B) to (P) Confocal images showing the localization of POD1m-GFP ([B], [E], [H], [K], and [N]), ER marker mCherry-HDEL ([C], [F], [I], and [O]) in respective channels, and the merged images ([D], [G], [J], [M], and [P]).
(B) to (D) Confocal images of the same protoplast showing that the N-terminal deletion (POD1DN-ter-GFP) disrupted the ER localization of POD1.
(E) to (G) Confocal images of the same protoplast showing C-22aa deletion (POD1DC-22aa-GFP) abolished the ER localization of POD1.
(H) to (J) Confocal images of the same protoplast showing that the CRRR mutation (POD1RXRRR>RXAAA-GFP) disrupted the ER localization of mCherry-HDEL. Arrows indicate the mislocalization of mCherry-HDEL.
(K) to (M) Confocal images of the same protoplast showing the nuclear localization of POD1Nter-GFP.
(N) to (P) Confocal images of the same protoplast showing POD1ΔLR-GFP disrupted the ER localization of mCherry-HDEL. Arrows indicate the mislocalization of mCherry-HDEL.
DN-ter, POD1 with the 60–amino acid N-terminal sequence deleted; DC-22aa, POD1 with the C-terminal 22 amino acids deleted; Nter, The N-terminal sequence including the LR; ΔLR, POD1 with the LR deleted. Bar = 50 μm.

