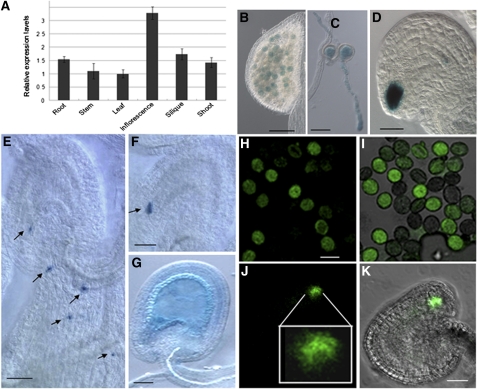
Figure 9.
Expression Pattern of POD1.
(A) Relative expression levels of POD1 in multiple tissues by real-time PCR. Bars represent the average ± se of normalized relative transcript levels of three replicates.
(B) to (G) GUS staining of POD1:POD1-GUS transgenic plants.
(H) to (K) POD1-GFP in pollen and synergid cells of POD1:POD1-GFP transgenic plants.
(B) POD1-GUS in pollen grains.
(C) POD1-GUS in pollen tubes germinated in vitro.
(D) POD1-GUS in synergid cells.
(E) POD1-GUS at pollen tube tips (arrows).
(F) POD1-GUS in wild-type ovules fertilized with POD1-GUS pollen (arrow).
(G) POD1-GUS in early embryo and endosperm.
(H) Confocal laser scanning microscopy images showing the POD1-GFP in pollen grains.
(I) Overlay of (H) and DIC image.
(J) Confocal laser scanning microscopy image showing the POD1-GFP in synergid cells. The image in the square is the enlarged view of the synergid cells.
(K) Overlay of (J) and DIC image. Bars = 50 μm.

