Figure 4.
Evidence of Plastid Genome Change in the msh1 Mutant.
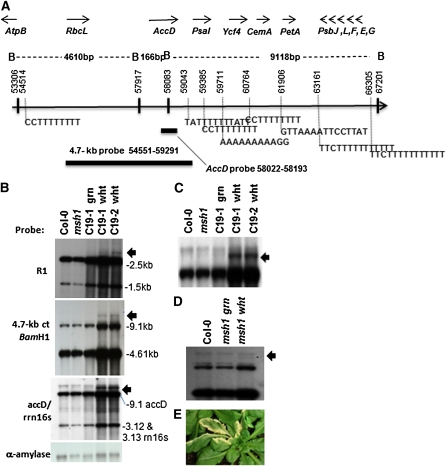
(A) Map of the chloroplast region encompassing one site of rearrangement. Genes encoded in this region are shown as well as the BamHI restriction map of the interval. Numerous short repeats associated with micro-homology-mediated recombination are present, and two probes used in (B) to (D) are shown.
(B) DNA gel blot analysis shows recombination polymorphisms (arrows) in dissected white tissues from two chloroplast hemicomplementation lines (C19-1 and 19-2). R1 is a small repeat located at coordinates 38655 to 38777 for copy 1 and 40879 to 41001 for copy 2. Copy 1 is part of the psaB gene, and copy 2 is part of the psaA gene. The bottom panel shows nuclear α-amylase probe as DNA loading control for each lane.
(C) Enlargement of DNA gel blot in (B) probed with accD and rrn16s.
(D) The wild type and msh1 mutant dissected to white and green sector tissues. DNA samples were probed with the 4.7-kb chloroplast fragment.
(E) Chloroplast hemicomplementation line showing the white sectors used for analysis.

