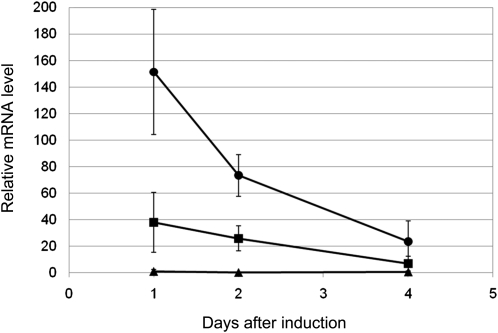
Figure 11.
Time Course of MFT Expression after Transformation with Ubi:TaMFT or Ubi:TaMFT(Stop).
The expression level of MFT was analyzed by qRT-PCR using isolated immature embryos of Bobwhite (BW) cultured for 1, 2, and 4 d after transformation with Ubi:TaMFT or Ubi:TaMFT(Stop). Closed circles, Ubi:TaMFT; closed squares, Ubi:TaMFT(Stop); closed triangles, untransfomed, isolated immature embryos simply placed on the medium. Results from triplicate independent biological samples (n = 3) are shown, and error bars represent sd. The expression level was normalized to the level of MFT of CS at DAA60 (Figure 5C), which was set as 1.

