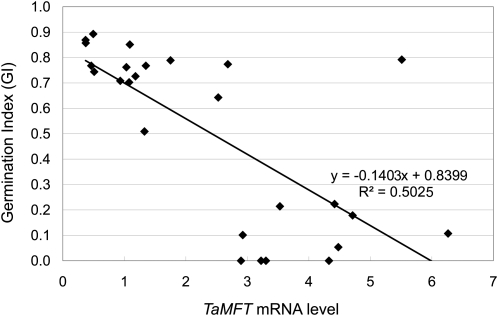
Figure 8.
Correlation between MFT Expression Level and Germination Index in T1 Seeds.
MFT mRNA levels and germination index were measured using T1 seeds from the same spikes of 26 independent T0 plants (n = 26) that were produced by transforming CS with the entire genomic sequence of Zen MFT3A. The MFT expression level was measured using qRT-PCR. Total RNA was extracted from embryos of 30 seeds. The expression level was normalized to the level of MFT of CS at DAA60 (Figure 5C), which was set as 1. The germination index was measured using 16 or 24 seeds incubated at 20°C for 7 d.

