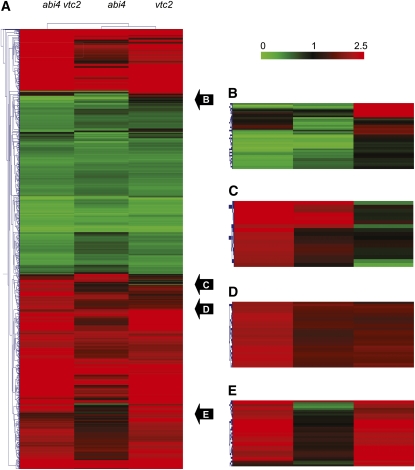
Figure 7.
Cluster Analysis Comparison of the abi4, vtc2, and abi4 vtc2 Transcriptomes Relative to Col-0.
(A) Whole transcript profile.
(B) Examples of transcripts uniquely expressed in vtc2 relative to Col-0.
(C) Examples of transcripts whose expression is reversed in vtc2 relative to abi4 vtc2.
(D) Examples of transcripts that are expressed in a similar manner in abi4 and vtc2 relative to Col-0.
(E) Examples of transcripts that are expressed in vtc2 and abi4 vtc2 in a similar manner relative to Col-0.

