Figure 6.
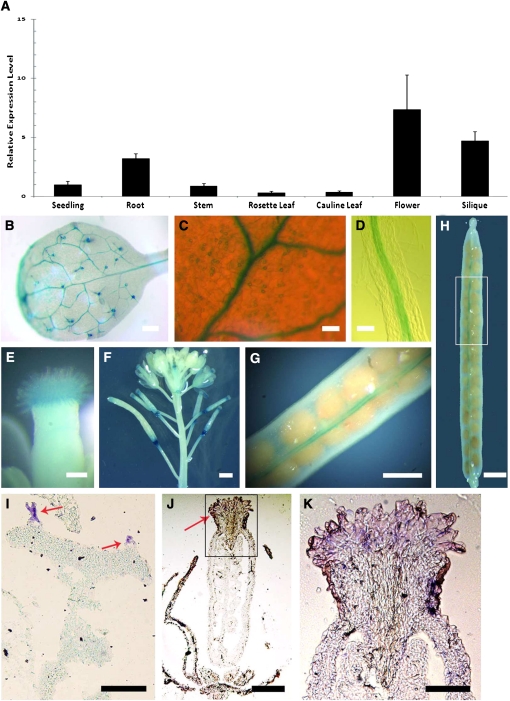
Spatial Expression Pattern of At CFL1.
(A) Analysis of At CFL1 expression level in different organs by quantitative RT-PCR. The expression level in the seedling is set to 1.0, and error bars represent sd of three biological replicates.
(B) GUS-stained 5th true leaf of Arabidopsis.
(C) Magnification of a GUS-stained 5th true leaf of Arabidopsis.
(D) Longitudinal view of GUS-stained root from 10-d-old seedling.
(E) GUS-stained stigma.
(F) GUS-stained inflorescence stem with buds, flowers, and siliques.
(G) and (H) GUS-stained silique. (G) is a higher magnification of the boxed region in (H).
(I) to (K) Accumulation of At CFL1 transcripts, as visualized by in situ hybridization of the leaf tissues (I) and inflorescence ([J] and [K]). (K) is the higher magnification of the boxed region in (J). Arrows indicate trichomes in (I) and stigma in (J).
Bars = 1 mm in (B), (F), (H), and (I), 50 μm in (C), (D), and (K), 0.1 mm in (E), 20 μm in (K), and 0.5 mm in (G).

