Figure 7.
SALK T-DNA Insertion Mutant of At CFL1.
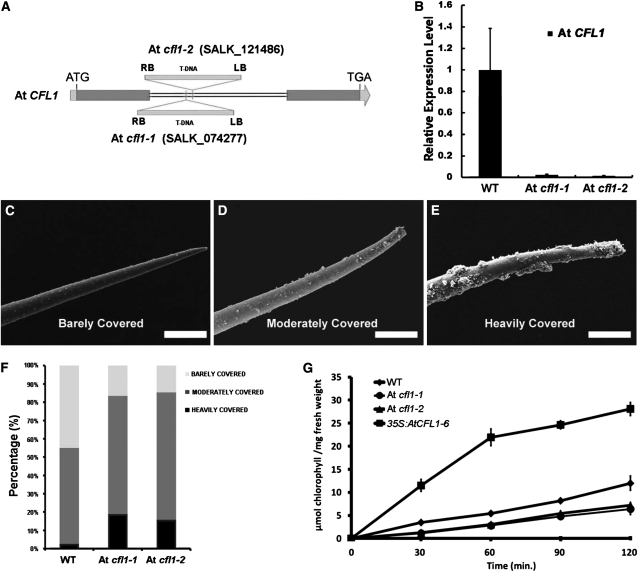
(A) T-DNA insertion sites in At CFL1. The arrow represents the trancriptional orientation of the gene. LB, T-DNA left border; RB, T-DNA right border. Blue boxes, exons; gray boxes, untranslated regions; double lines, introns.
(B) Relative expression level of At CFL1 in wild-type (WT), At cfl1-1 (SALK_074277), and At cfl1-2 (SALK_121486) plants. The expression level in the wild type is set to 1.0, and error bars represent the sd of three biological replicates.
(C) to (E) Scanning electron microscopy of Arabidopsis stem trichome barely covered (C), moderately covered (D), and heavily covered (E) with wax. Bars = 25 μm.
(F) Relative percentage of each kind of trichome in the wild type and SALK mutants.
(G) Chlorophyll leaching assays with mature rosette leaves of the wild type, SALK mutants, and 35S:AtCFL1-6 submerged in 80% ethanol for different time intervals. The results are from three independent assays.

