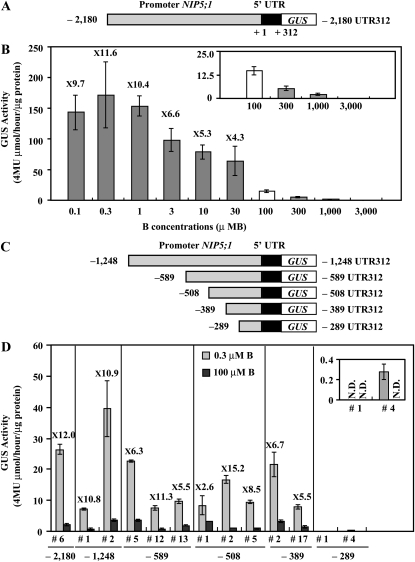
Figure 1.
GUS Activity and Deletion Analysis of the NIP5;1 Promoter in Response to B in Roots.
(A) Schematic representation of the P-2,180 UTR312-GUS construct. The nucleotides are numbered from the transcription start site (+1).
(B) Transgenic plants (#6) were grown for 14 d on plates with various B concentrations, and the GUS activity in roots was measured. The small window represents the scale-up of the data for 100, 300, 1000, and 3000 μM B. The numerals in the figure indicate ratios of the GUS activity in roots grown under 0.1, 0.3, 1, 3, 10, and 30 μM B to the GUS activity in roots grown under the 100 μM B condition (induction ratio). Means of three biological replicates ± sd (n = 3) are shown.
(C) Schematic representation of transformation constructs. P-1,248 UTR312-GUS, P-589 UTR312-GUS, P-508 UTR312-GUS, P-389 UTR312-GUS, and P-289 UTR312-GUS constructs are shown as –1248, –589, –508, –389, and –289 UTR 312, respectively. The nucleotides are numbered from the transcription start site (+1).
(D) Transgenic plants were grown for 7 d on plates with 0.3 or 100 μM B and the GUS activity in roots was measured. The small window represents the scale-up of the data for P-289 UTR312-GUS constructs. The numerals in the figure indicate induction ratios of the GUS activity in roots grown under the 0.3 μM B condition to the GUS activity in roots grown under the 100 μM B condition. Means of three biological replicates ± sd (n = 3) are shown.

