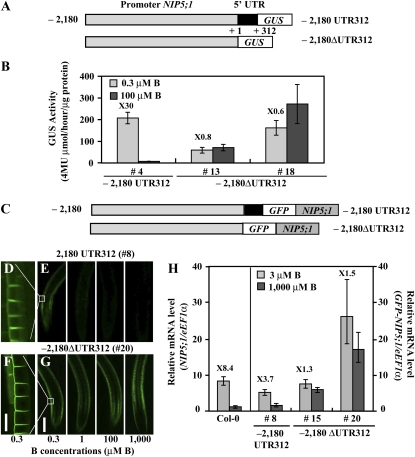
Figure 2.
The 5′ UTR Is Involved in B-Dependent Gene Expression in Roots.
(A) Schematic representation of transformation constructs. P-2,180 UTR312-GUS and P-2,180 ΔUTR312-GUS constructs are shown as 2180 UTR312 and –2180 ΔUTR312, respectively. The nucleotides are numbered from the transcription start site (+1).
(B) Transgenic plants were grown for 11 d on plates with 0.3 or 100 μM B and GUS activity in roots was measured. The numerals in the figure indicate induction ratios of the GUS activity in roots grown under the 0.3 μM B conditions to the GUS activity in roots grown under the 100 μM B conditions. Means of three biological replicates ± sd (n = 3) are shown.
(C) Schematic representation of transformation constructs. P-2,180 UTR312-GFP-NIP5;1 and P-2,180ΔUTR312-GFP-NIP5;1 are shown as –2180 UTR312 and –2180 ΔUTR312, respectively. The nucleotides are numbered from the transcription start site (+1).
(D) to (G) Transgenic plants were grown for 14 d on plates containing 0.3, 1, 100, or 1000 μM B and visualized by confocal microscopy ([E] and [G]). The images show GFP-derived fluorescence in the root differentiation zone. Bar = 200 μm. (D) and (F) represent the scale-up of the images of 0.3 μM B in (E) and (G), respectively. Bar = 25 μm.
(H) B-dependent NIP5;1 or GFP-NIP5;1 mRNA accumulation in roots was quantified by qRT-PCR analysis. Transgenic plants were grown for 11 d on plates containing 3 or 1000 μM B. The numerals in the figure indicate induction ratios of the NIP5;1 or GFP-NIP5;1 mRNA accumulation in roots grown under the 3 μM B conditions to the NIP5;1 or GFP-NIP5;1 mRNA accumulation in roots grown under the 1000 μM B conditions, respectively. Means of three biological replicates ± sd (n = 3) are shown.

