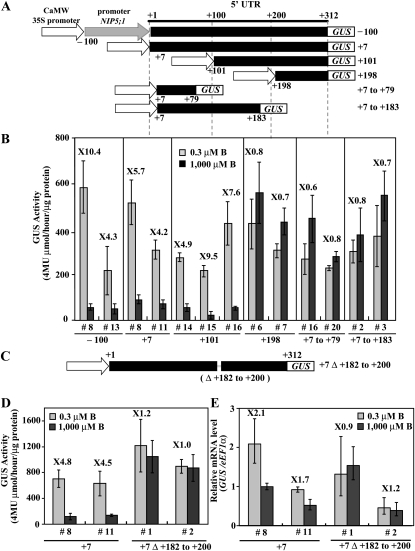
Figure 4.
Identification of the 5′ UTR Region Required for B Response in Roots.
(A) Schematic representation of transformation constructs. P35S-100UTR312-GUS, P35SUTR+7-GUS, P35SUTR+101-GUS, P35SUTR+198-GUS, P35SUTR+7 to 79-GUS, and P35SUTR+7 to +183-GUS constructs are shown as –100, +7, +101, +198, +7 to +79, and +7 to +183, respectively. The nucleotides are numbered from the transcription start site (+1).
(B) Transgenic plants were grown for 11 d on plates with 0.3 or 1000 μM B, and the GUS activity in roots was measured. The numerals in the figure indicate induction ratios of the GUS activity in roots grown under the 0.3 μM B conditions to the GUS activity in roots grown under the 1000 μM B conditions. Means of three biological replicates ± sd (n = 3) are shown.
(C) Schematic representation of transformation constructs. P35SUTR+7Δ+182-+200-GUS constructs is shown as +7Δ+182 to +200.
(D) Transgenic plants were grown for 11 d on plates with 0.3 or 1000 μM B and the GUS activity in roots was measured. The numerals in the figure indicate induction ratios of the GUS activity in roots grown under the 0.3 μM B conditions to the GUS activity in roots grown under the 1000 μM B conditions. Means of three biological replicates ± sd (n = 3) are shown.
(E) Transgenic plants were grown for 11 d on plates with 0.3 or 1000 μM B and GUS mRNA was quantified by qRT-PCR. The numerals in the figure indicate induction ratios of the GUS mRNA accumulation in roots grown under the 0.3 μM B conditions to the GUS mRNA accumulation in roots grown under the 1000 μM B conditions. Means of three biological replicates ± sd (n = 3) are shown.

