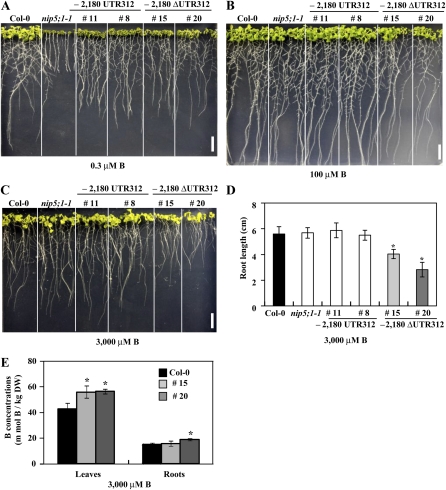
Figure 6.
The 5′ UTR Affects Plant Growth and B Accumulation.
(A) to (C) Transgenic plants carrying P-2,180 UTR312-GFP-NIP5;1 or P-2,180ΔUTR312-GFP-NIP5;1, Col-0, and nip5;1-1 were grown on plates containing 0.3 μM B for 11 d, 100 μM B for 12 d, and 3000 μM B for 14 d. Bars = 10 mm.
(D) Root length of Col-0, nip5;1-1, and transgenic plants grown under 3000 μM B for 14 d was measured (n = 4 to 5). Means of four to five biological replicates ± sd are shown. Asterisks indicate a significant difference from Col-0 plants (P < 0.05, Student’s t test).
(E) B concentrations in roots and rosette leaves of plants grown under 3000 μM B for 14 d were determined using inductively coupled plasma–mass spectrometry (n = 3). Means of three biological replicates ± sd are shown. Asterisks indicate a significant difference from Col-0 plants (P < 0.05, Student’s t test).

