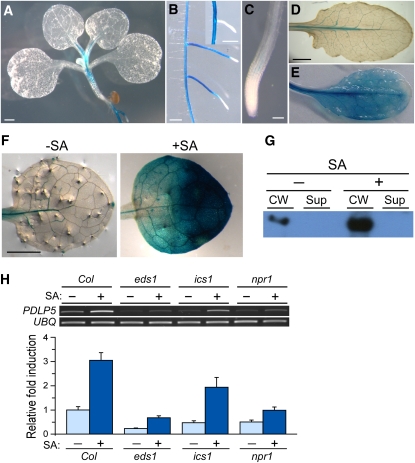
Figure 10.
Control of PDLP5 Expression by SA Pathway.
(A) to (E) GUS-stained PDLP5pro:GUS under normal growth conditions. Arial tissue of 6-d-old seedling (A); primary root and elongated secondary roots (B); primary root tip (C); and young (D) and senescing rosette leaves (E).
(F) and (G) Histochemical and immunoblot analyses showing PDLP5 induction by exogenous SA. Mock and 100 μM SA-treated PDLP5pro:GUS leaves (F). Immunoblot analysis with α-PDLP5 showing the PDLP5 protein induction in wild-type leaves by SA treatment (G). CW, cell wall; Sup, supernatant fractions.
(H) PDLP5 expression in various SA pathway mutants in the presence and absence of exogenous SA application. RT-PCR products were electrophoresed in ethidium bromide–containing 0.8% agarose gel and visualized under UV (top). Quantification of PDLP5 transcript level was normalized to the corresponding UBQ level using ImageJ software (bottom). The data set between treatments is significantly different at P < 0.0001. Bars indicate se. Col, Columbia-0.
[See online article for color version of this figure.]

