Figure 3.
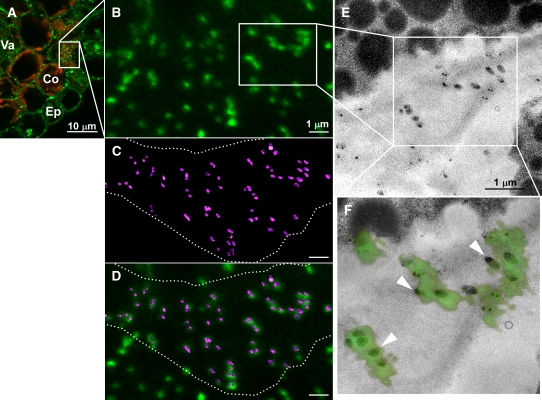
Correlative Light Electron Microscopy Analysis Showing That PDLP5-GFP Signals Overlap with PD Structures.
(A) Confocal image of a fixed, 50-μm-thick cryosection from hypocotyl tissue exposing the face-on view (boxed area) of dispersed PD at the cross-wall between cortex cells. Red, chlorophyll autofluorescence; green, PDLP5-GFP signals. Co, cortex; Ep, epidermis; Va, vasculature.
(B) to (F) Correlation between confocal image of PDLP5-GFP and electron microscopy images. PDs were false-colored in magenta for contrast. Dotted lines, boundary of cell wall area; arrowheads, correlated small clusters of PDs.
(B) High magnification of punctate PDLP5-GFP signals on a cross-wall from the rotated, boxed region in (A).
(C) A 3D rendering of nine serial ultrathin TEM sections of the imaged cell wall junction, corresponding to the same region in (B).
(D) Overlay of (B) and (D).
(E) Single section TEM image of boxed region in (B).
(F) Overlay of the PDLP5-GFP (boxed region in [B]) and TEM image in (E).

