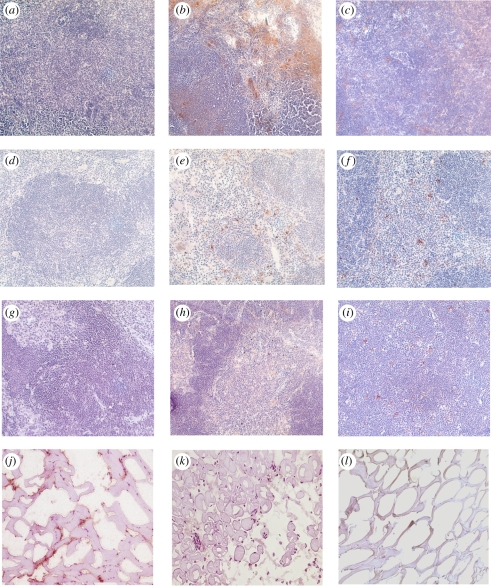
Figure 3.
Bio-distribution of the biotinylated polymer in different lymphoid organs. Tissue sections from control mice (a,d,g) and mice sacrificed on day 1 (b,e,h) and day 30 (c,f,i) after biotinylated PNiPAAm-co-allylamine injection are shown. Lymph nodes (a–c), spleen (d–f) and thymus (g–i) samples were used. Liver sections did not show any staining for the polymer (data not shown). Immunostaining of CII with monoclonal antibodies recognizing native (j) CB20 or denatured (k) GB8 conformations. Control staining (l). All the images were taken at 20× magnification. (Online version in colour.)

