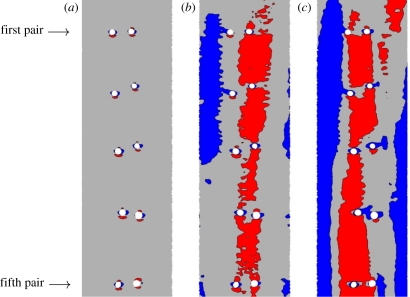
Figure 10.
En face three-colour maps of WSS in electronically ‘excised and unwrapped’ sections of the descending thoracic aorta when (a) Re = 50, (b) Re = 300, and (c) Re = 1300. Blue shading denotes areas in which WSS is <75% of the average in each excised region, and red shading denotes areas in which WSS is >125% of the average in each excised region. Specifically, when Re = 50, blue denotes a WSS <0.218 Pa and red denotes a WSS >0.364 Pa, when Re = 300, blue denotes a WSS <1.53 Pa and red denotes a WSS >2.56 Pa, and when Re = 1300, blue denotes a WSS <9.40 Pa and red denotes a WSS >15.7 Pa. In all cases, the descending aorta was unwrapped via a ‘computational incision’ along the ventral aortic wall, and the colour maps are presented with the luminal surface facing upwards. The first and fifth intercostal branch pairs are marked as reference points. Flow is from top to bottom.

