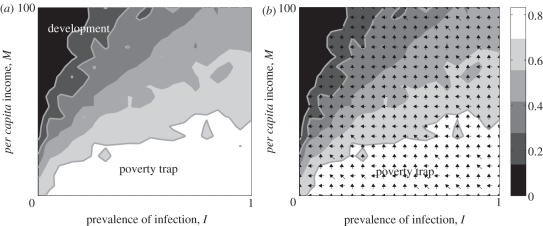
Figure 4.
(a) Phase plot illustrating probabilities that an initial condition will lead to development or a poverty trap. Each solid line corresponds to a single probability of reaching either the development or poverty-trap equilibrium. (b) The arrows indicate the quickest path to the development equilibrium. Note that this path depends on the status of the level of income and disease. α = 0.06, ν = 0.02, r = 0.05, β1 = 40, ɛ = 15, δ = 0.15, ρ = 90, κ = 100, M0 = 100, σ = 3.

