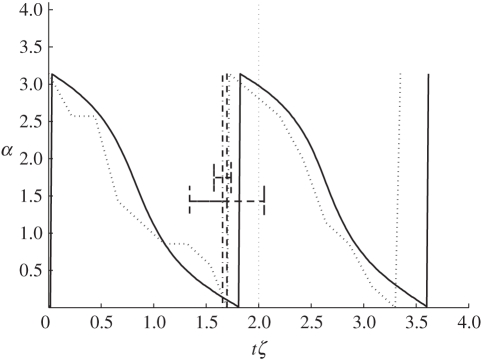
Figure 4.
Comparison of the simulated platelet-flipping dynamics with the experiment results for human platelets. The solid curve represents the simulation and the dark-dashed curves represent the results from experiment sets 1 and 2 with error bars at 1 s.d, both showing good correlation with the simulated flipping times. The light-dotted curve represents the actual measured angle of the representative platelet. The variation in angle α to the platelet major axis is plotted against the unit-less time, shear-rate product tζ. Solid line, simulation with γ = 250; dotted line, sample experiment data; dashed–dotted line, experiment 1, tζ; dashed line, experiment 2, tζ.

