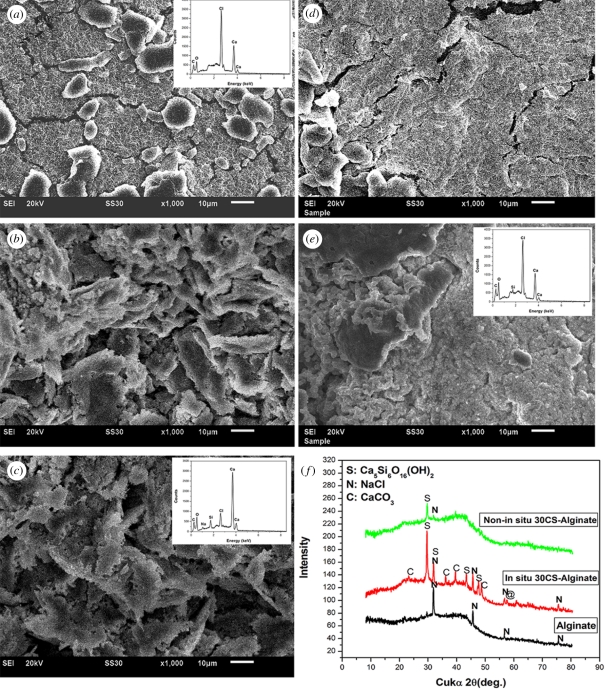
Figure 2.
SEM images for the surface of (a) pure A, (b) in situ 15CS–A, (c) in situ 30CS–A, (d) non-in situ 15CS–A and (e) non-in situ 30CS–A microspheres; (f) XRD pattern for the obtained microspheres. Silicate particles mainly composed of Ca5Si6O16(OH)2 phase were formed on the surface of (b) in situ 15CS–A and (c) in situ 30CS–A microspheres; however, (d) pure A, non-in situ 15CS–A, and (e) non-in situ 30CS–A showed a more smooth surface, compared with in situ CS–A microspheres. (f) XRD shows main Ca5Si6O16(OH)2 phase in the in situ 30CS–A and non-in situ 30CS–A microspheres. (c) EDS shows the Ca and Si elements in the in situ 30CS–A and (e) non-in situ 30CS–A microspheres. (a) The ratio of Ca–Si in the in situ 30CS–A and non-in situ 30CS–A microspheres was 20.3 and 33.2, respectively. No Si element was detected in pure A microspheres. (Online version in colour.)

