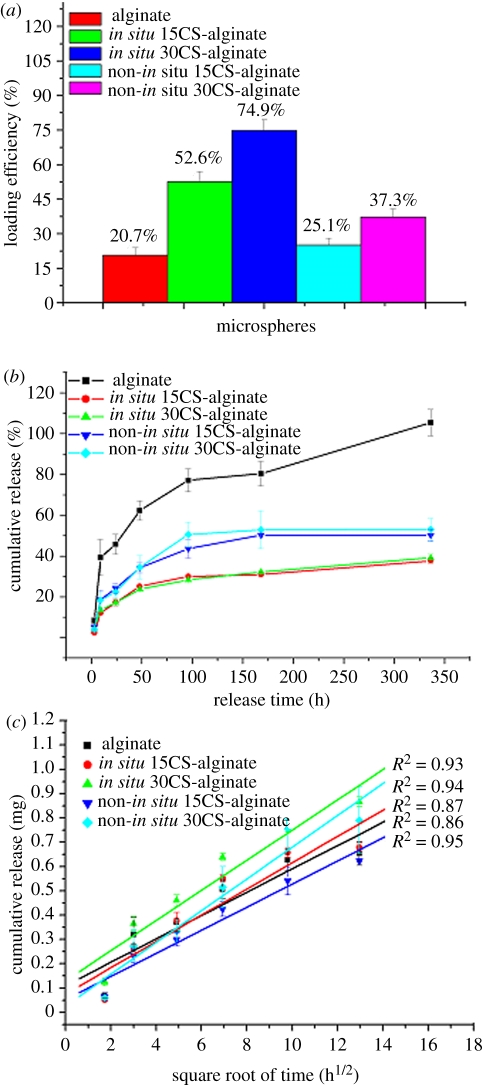
Figure 5.
(a) The loading efficiency of protein (BSA) in the microspheres. In situ CS–A microspheres have higher loading efficiency than pure A and non-in situ CS–A microspheres. With the increase of CS contents in A microspheres, the loading efficiency improved. (b) Protein (BSA) release kinetics from microspheres in PBS with a pH 7.4 and (c) the linear relationship of release and square root time (h1/2). (b) Shows the in situ CS–A microspheres with core-shell structure have a slower BSA release than pure A and non-in situ CS–A microspheres. The linear relationship of release and square root time in figure (c) indicates the diffusing mechanism of protein release from microspheres. (Online version in colour.)

