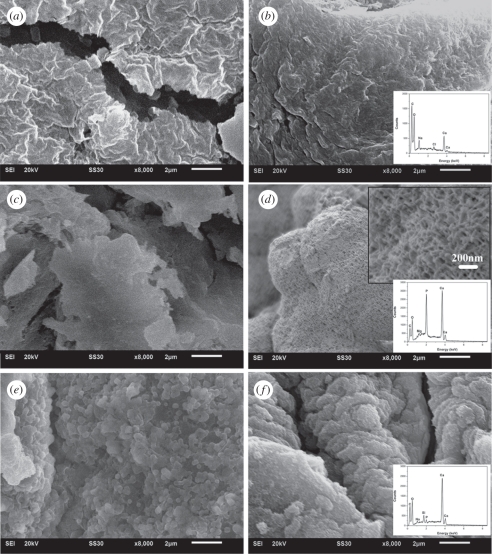
Figure 8.
SEM micrographs and EDS analysis for the microspheres before and after soaking in SBFs for 3 days. Alginate microspheres (a) before and (b) after soaking, in situ 30CS–A microspheres (c) before and (d) after soaking, non-in situ 30CS–A microspheres (e) before and (f) after soaking. (b) No apatite particles formed on pure A microspheres after soaking in SBF. (d) Apatite layer composed of lath-like particles formed on the surface of in situ 30CS–A microspheres. (f) There are a few apatite particles on the surface of non-in situ 30CS–A microspheres. (f) EDS analysis shows that P peaks were very obvious for in situ 30CS–A microspheres in SBF and the ratio of Ca–P of apatite is 1.82. There is a weak P peak for non-in situ 30CS–A microspheres in SBF and the ratio of Ca–P of apatite is 23.9.

