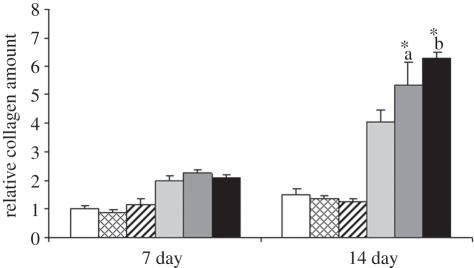
Figure 10.
The relative collagen production of hASCs cultured in BM or OM, non-stimulated or stimulated with 50 or 100 Hz vibration loading at the 7 and 14 day time points. Results are expressed as mean + s.d. *a p < 0.05 with respect to OM, OM 100 Hz, BM, BM 50 Hz and BM 100 Hz. *b p < 0.05 with respect to OM, OM 50 Hz, BM, BM 50 Hz and BM 100 Hz. White bars, BM; bars with squares, BM 50 Hz; bars with cross lines, BM 100 Hz; light grey bars, OM; dark grey bars, OM 50 Hz; black bars, OM 100 Hz.

