Figure 4.
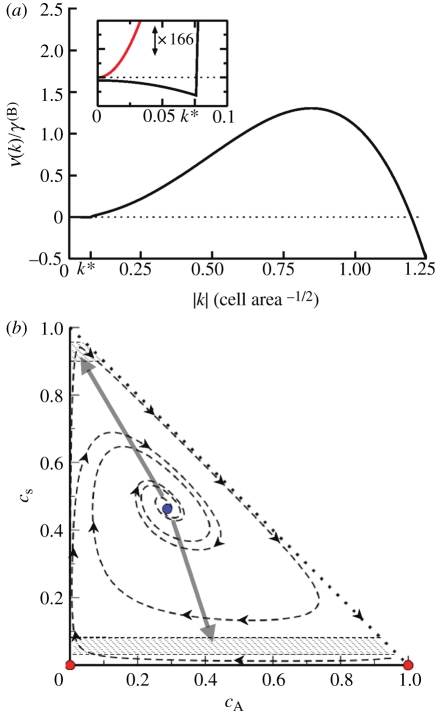
(a) Dispersion relation for the response of the system to fluctuations about the fixed point, showing stability at small wavenumbers k and spinodal-like instability at larger values of k. Inset: focus on the short wavenumber region of the dispersion relation, with vertical axis magnified ×166. The system shows a weak stable response at long wavelengths, in contrast to the case when reactions are turned off (red curve). The wavenumber k* indicates the crossover to reactionless behaviour, setting the length scale at which the pattern is stable; 1/k* ∼ 10 − 20 cells is consistent with the stem cell cluster size observed in experiment [14,21]. Parameters used for plotting: rΓ = 200, rΔ = 2, γA(S) = 0.02, rSS(S) = 4, σ = 2, J = 12, α = 0.33. (b) The state diagram for the homogeneous-density solution to equation (3.1), projected onto the (cS, cA) plane. The system exhibits two unstable fixed points (red) and one stable fixed point (blue). Spatial fluctuations induce phase separation (grey arrows) into the metastable regions (hashed), which are themselves incapable of sustaining an extended homogeneous domain. (Online version in colour.)

