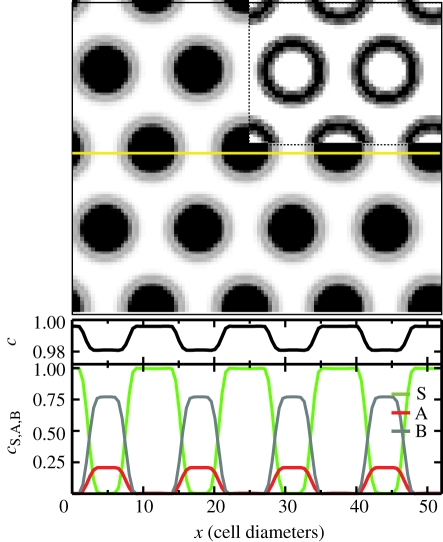
Figure 5.
Predicted steady-state distribution of stem cells in the basal layer obtained from the kinetic theory (3.1). Stem cells aggregate into a periodic array of clusters (black), within a sea of committed progenitor and PM cells (white). The regularity of the pattern is due to the ‘mean-field’ character of the theory, which describes the average behaviour of the population. The location of dividing stem cells (with γSS(S) > 0) is shown inset for the same stationary state (black), revealing that stem cells deep within each cluster are quiescent. The lower panels show the total cell density c, and the density of stem (type S), committed progenitor (type A) and PM (type B) cells along the marked cross section (yellow). Parameters used for this calculation are σ = 2, J = 12, α = 0.33, χ = 1, rΓ = 200, γSS(A)/rΓ = 0.02, rΔ/rΓ = 0.01, γ(B) = 1 and γA(S) = 0.01. (Online version in colour.)

