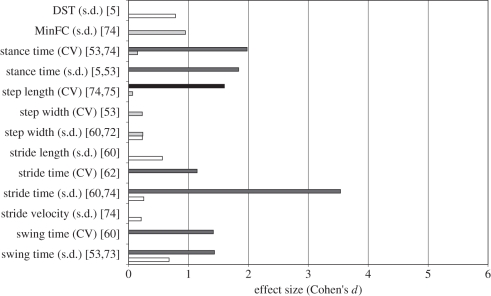
Figure 2.
Effect size (ES; presented as Cohen's d) for each linear outcome measure for studies comparing fallers versus non-fallers. The outcome measures are defined with the kinematic parameter measured (e.g. stride time and minimum foot clearance) followed by the mathematical algorithm used to estimate stability indicated in parenthesis (e.g. CV and s.d.). The studies in which the respective measures are included are then indicated in squared brackets next to the outcome measures. For example, stride time (CV) [75] indicates that the kinematic parameter analysed was stride time, the mathematical algorithm, CV, was applied to stride time in the study. The error bars indicate the standard deviation (s.d.) of ES across studies. In cases, where the outcome measure was applied in only one study, no error bars are shown. Cohen's d values were classified into four different faller definition categories (cat. 1—cat. 4): studies with at least one fall in the 12 months following data collection (white bars, cat. 1); studies with at least one fall in the 12 months prior to data collection (light grey bars, cat. 2); studies with at least one fall in the 5 years prior to data collection (dark grey bars, cat. 3); and studies with at least one fall in the 13 weeks following data collection (black bars, cat. 4). Asterisk indicates a negative ES, indicating reduced step width variability among fallers [53].

