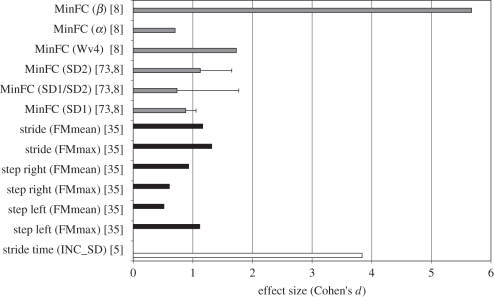
Figure 3.
Mean ES (presented as Cohen's d) for each nonlinear outcome measure for studies incorporating fallers versus non-fallers comparison. The error bars indicate s.d.s for all cases in which the outcome measure was applied in more than one study. Cohen's d values were classified into three faller definition categories (white bars, cat. 1, grey bars, cat. 2 and black bars, cat. 5): studies with at least one fall in the 12 months following data collection (cat. 1); studies with at least one fall in the 12 months prior to data collection (cat. 2) and studies with at least three falls in the 6 months prior to data collection (cat. 5). Studies using faller definition categories 3 and 4 did not use nonlinear measures.

