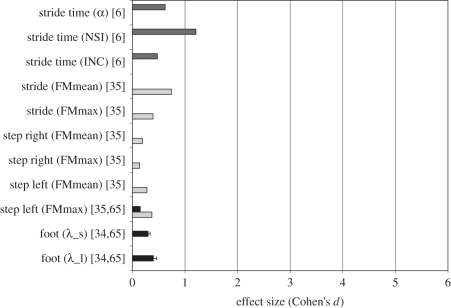
Figure 5.
Mean ES (presented as Cohen's d) for each nonlinear outcome measure for studies incorporating old versus young comparisons. Cohen's d values were classified into three different mean age difference categories: mean age difference between 40 and less than 45 years (light grey bars) between 45 and less than 50 (black bars); and greater than 50 (dark grey bars).

