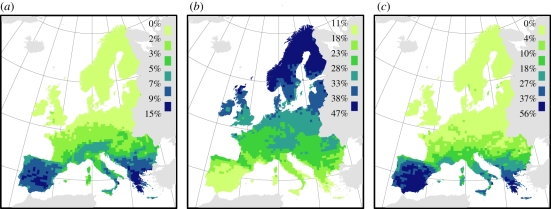
Figure 2.
Geographical patterns in the importance of accessibility and climate for species occurrences across Europe. Average variation in species occurrences uniquely explained by (a) accessibility  , or (b) climate
  . (c) Percentage of species with
  >
>  . All values were calculated across species with a positive model-averaged accessibility coefficient (n = 655) in each ca 50 × 50 km AFE cell. Maps are in the ETRS 1989 Lambert Azimuthal Equal Area projection.

