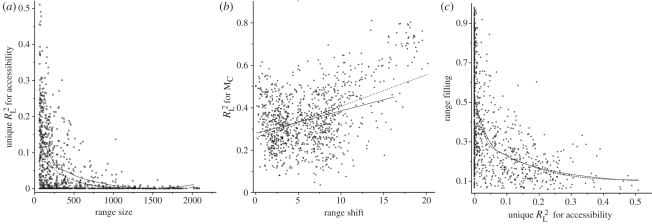
Figure 4.
Relationship between the importance of accessibility for species occurrences and (a) species current range size, (b) estimated range shift since LGM, and (c) range filling. Unique  for accessibility represent the variation in species occurrences uniquely explained by accessibility after controlling for the effect of climate (shown for all species, n = 1016). Linear and Gaussian local (loess, fitted with span = 0.75 and a quadratic term) regressions were fitted either for all species or only for species with a positive model-averaged accessibility coefficient (n = 655). (a) Dashed line with circles, all (loess: R2 0.23); solid line, βMA(A) > 0 (loess: R2 0.29); (b) dashed line with circles, all (linear: R2 0.20); solid line, βMA(A) > 0 (linear: R2 0.07); (c) dashed line with circles, all (loess: R2 0.35); solid line, βMA(A) > 0 (loess: R2 0.37).

