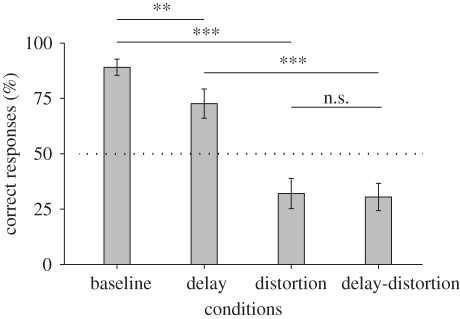
Figure 4.
The effect of temporal delay and spatial distortion. Bars show the mean percentages of correct trials for all test sessions. Performance declined following experimental adjustments of either the temporal or the spatial dimension. Asterisks indicate significance at *p < 0.01, **p < 0.005 and ***p < 0.001 in χ2-tests. The dashed line represents the expected chance level. Error bars show 95% confidence intervals.

