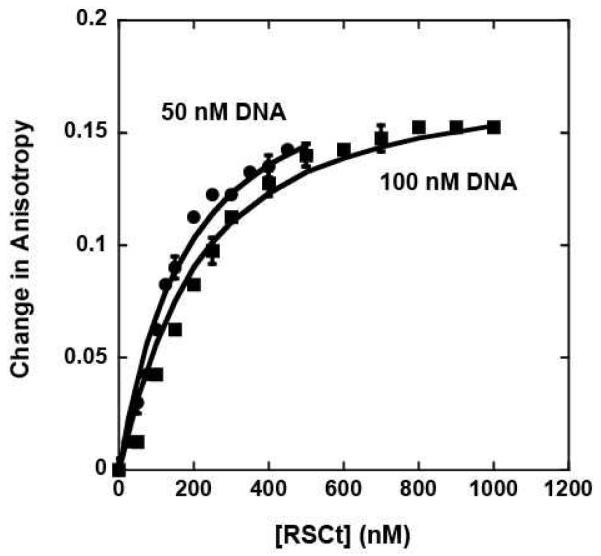
Figure 1.
Fluorescence anisotropy measurements of RSCt binding to DNA in the absence of nucleotide. The binding experiment involved monitoring the changes in the anisotropy of the fluorescein labeled 20 bp DNA as a function of both RSCt and DNA concentration as described in Materials and Methods. Binding isotherms collected with initial DNA concentrations of 50 nM and 100 nM were analyzed simultaneously using equations (2) though (6) to determine an estimate of (140 ± 20) nM for the Kd of the interaction. The solid lines are the associated fits of this data to this model.

