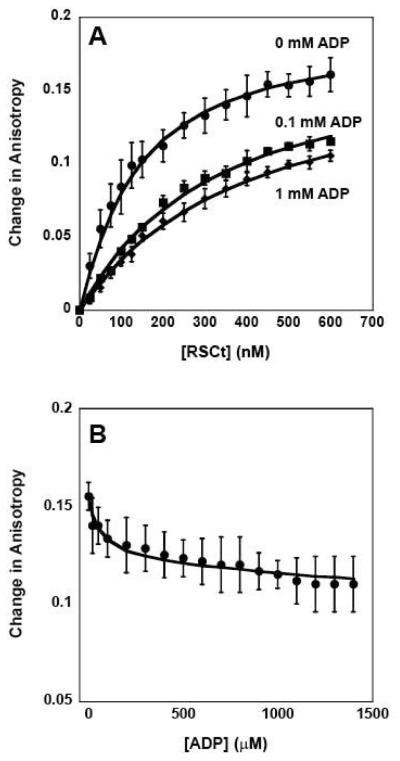
Figure 3.
Fluorescence anisotropy measurements of the equilibrium DNA binding by RSCt in presence of ADP. (A) Representative traces of binding isotherms collected in the presence of 0 mM ADP (circles), 0.1 mM ADP (squares), and 1 mM ADP (diamonds). In these experiments the total initial DNA concentration was 50 nM. (B) Representative trace of binding isotherms collected in experiments in which pre-formed RSCt-DNA complexes were titrated with ADP. In these experiments the intial RSCt and DNA concentrations are 500 nM and 50 nM, respectively. The solid lines in both panels are the associated fits of all data to Scheme 1 (equations (2) through (6)).

