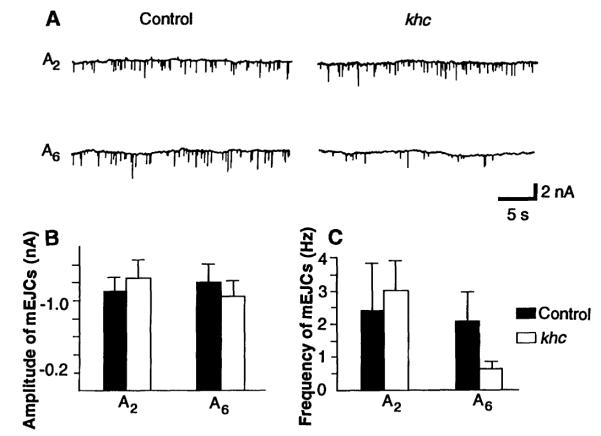
Fig. 2.
Spontaneous miniature excitatory junctional currents recorded from control and khc mutant muscles. (A) Representative traces of mEJCs obtained from muscle 6 in the second (A2) and sixth (A6) abdominal segments. Histograms show mean and standard deviation values for the amplitude (B) and frequency (C) of mEJCs in control and khc mutant muscles. In (C) the values for segment A6 are significantly different as determined by the Student’s test (P < 0.01). The number of animals tested was five controls and five mutants for segment A2 and six controls and six mutants for segment A6. Data were collected for at least 30 s from each muscle. To obtain good resolution in mEJC recordings, the holding potential was ~100 mV. The external calcium concentration was 0.15 mM.

