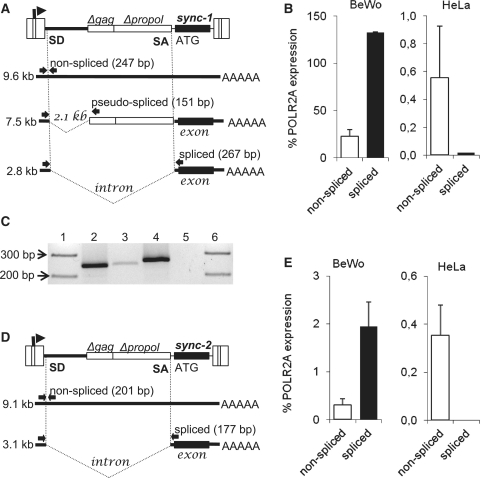
Figure. 2.
Expression and splicing of ERVWE1 and ERVFRDE1 proviruses in trophoblastic and non-placental cells. Splicing strategies of (A) ERVWE1 and (D) ERVFRDE1 are shown together with the positions of primers for splicing-specific PCR (arrows) and the sizes of diagnostic PCR products. The levels of non-spliced (open columns) and spliced (black columns) transcripts of (B) ERVWE1 and (E) ERVFRDE1 in BeWo and HeLa cells were estimated by qRT-PCR and are shown as the average percentage of the POLR2A expression ±SD from three triplicates. The low level of genomic DNA contaminating the RT–PCR product of non-spliced ERVWE1 mRNA in BeWo cells is shown (C). Lane 1, marker of molecular size; lane 2, non-spliced ERVWE1 mRNA RT+; lane 3, non-spliced mRNA RT−; lane 4, spliced mRNA RT+; lane 5, spliced mRNA RT−; lane 6, marker of molecular size.

