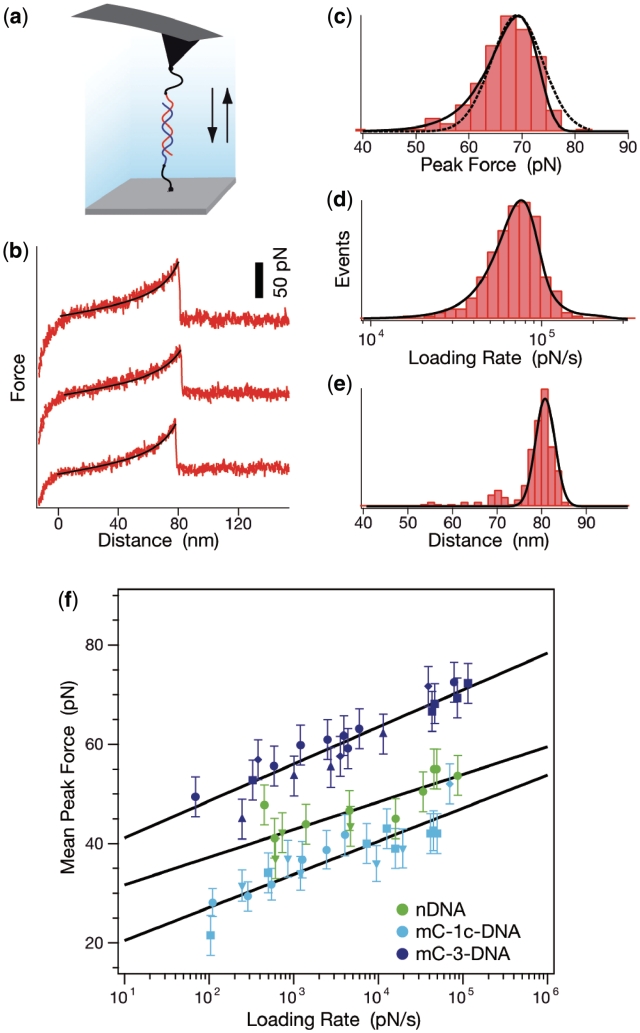
Figure 2.
(a) Single-molecule-force-spectroscopy setup. Complementary single strands of methylated and non-methylated 20 bp DNA duplexes possessing a thiol-group at their 5′-ends were covalently immobilized on amino-functionalized glass slides and cantilevers using heterobifunctional PEG spacers. (b) Typical force–extension curves of the mC-3-DNA duplex. The force–extension curves show three sequential rupture events of a hybridized 20 bp DNA duplex, recorded at a pulling velocity of 15 µm/s. The force–extension curves of the PEG–DNA complex follow the two-state freely jointed chain-fit (black). (c) Typical histogram of the unbinding force of the mC-3-DNA duplex, i.e. the peak force in (b), at a pulling velocity of 15 µm/s. The histogram contains approximately 300 rupture events and the mC-3-DNA duplex dissociates at a mean force of 68 pN. The histogram is fitted with the probability density function p(F) (solid curve) and a Gaussian (dotted curve). (d) Histogram of loadings-rates corresponding to (c); the loading rate is the slope of the curves in (b) just before the peak (rupture) force, multiplied by the pulling velocity. The histogram is fitted with the probability density function p(F) (black). (e) Histogram of the rupture distance distribution corresponding to (c) and (d); the distance is the value corresponding to the peak force in (b). (f) Graph showing the most probable rupture force plotted against the corresponding most probable loading rate for nDNA, mC-1c-DNA and mC-3-DNA. The data points were gained from Gaussian fits of the rupture force histogram [see (c)] and of the histogram of the loading rates [see (d)]. Experimental results conducted with the same cantilever for nDNA, mC-1c-DNA or mC-3-DNA are depicted with one type of marker. The data points are fitted to a straight line according to the loading-rate-based analysis method yielding the values of Δx and koff as given in the text.

