Figure 3.
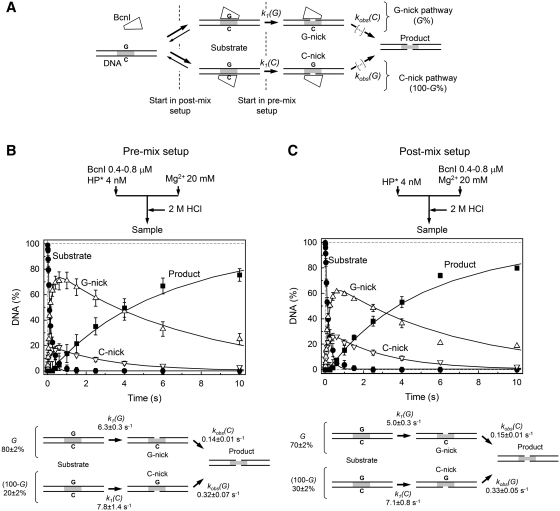
BcnI reactions on oligoduplex DNA. (A) Scheme for DNA cleavage by BcnI. BcnI may bind to the target site in two alternative orientations placing the active site in the vicinity of either the G- (5′-CCGGG-3′) or the C-strand (5′-CCCGG-3′). The ensuing nicking reactions [rate constants k1(G) and k1(C)] result in the nicked intermediates G- and C-nick, respectively. The fraction of substrate cleaved via the G-nick intermediate is designated by G(%); the fraction of substrate that follows the C-nick pathway corresponds to 100–G%. To complete the reaction after cutting the first DNA strand, BcnI must switch its orientation on the recognition site. All reaction steps that lead to cleavage of the second DNA strand are described by the rate constants kobs(G) and kobs(C). (B and C) Cleavage of the hairpin oligoduplex HP (Table 1) in the pre-mix and post-mix reactions, respectively. The flow diagrams above the graphs schematically depict the two types of experiments performed in a quench-flow device (see ‘Materials and Methods’ section for details). The amounts of four DNA forms are shown: intact substrate (filled circles), G-nick intermediate (up triangles), C-nick intermediate (down triangles), and final product (filled squares). All data points are presented as mean values from three or more independent experiments ±1 SD. Solid lines are the fit of the scheme in panel A to experimental data, assuming that the enzyme binding steps do not contribute to the observed DNA cleavage rates. Determined rate constants are listed below each graph.

