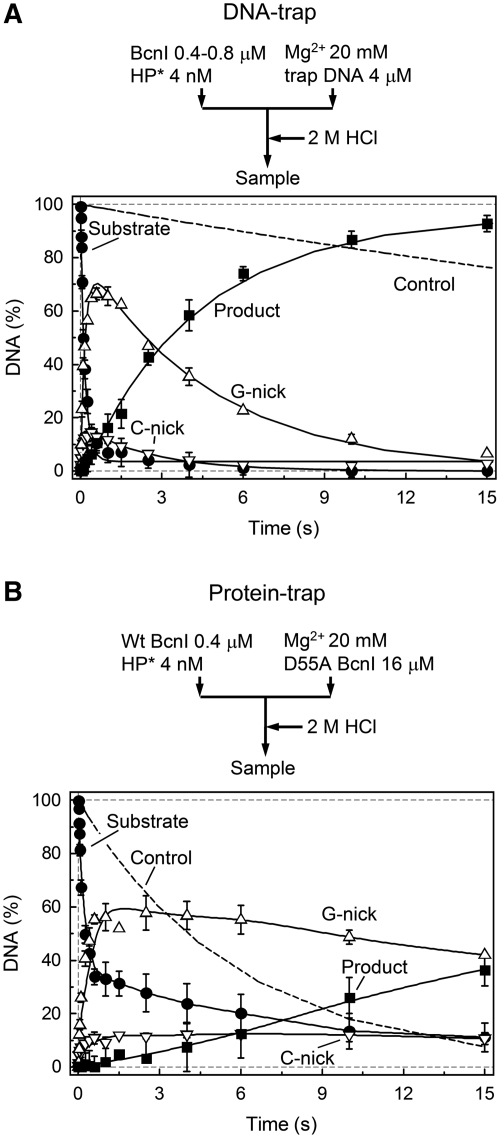
Figure 5.
Trap experiments. In both panels, change in the amount of intact DNA (filled circles), G-nick intermediate (up triangles), C-nick intermediate (down triangles) and final reaction product (filled squares) is shown. All data points are presented as mean values from two to six independent experiments ±1 SD. (A) Pre-mix experiment with trap DNA. A sample of enzyme preincubated with radiolabeled DNA was mixed with magnesium acetate and excess of unlabeled DNA. Data was quantified as in Figure 3B (solid lines). The fitting procedure gave k1(G) = 5.7 ± 0.4 s−1, k1(C) = 10.5 ± 4.0 s−1, kobs(C) = 0.21 ± 0.02 s−1, kobs(G) = 0.39 ± 0.16 s−1; the majority of DNA was cleaved via the G-nick intermediate (G = 84 ± 2%). The dashed line shows cleavage of DNA substrate in the control experiment where enzyme was added to the mixture of radiolabeled substrate and trap DNA. (B) Pre-mix experiment with trap protein. A sample of enzyme, preincubated with radiolabeled DNA was mixed with magnesium acetate and excess of the inactive BcnI mutant D55A. The dashed line shows cleavage of DNA substrate in the control experiment where wt BcnI was preincubated with both substrate and excess of D55A mutant prior to initiation of the reaction with Mg2+ ions.

