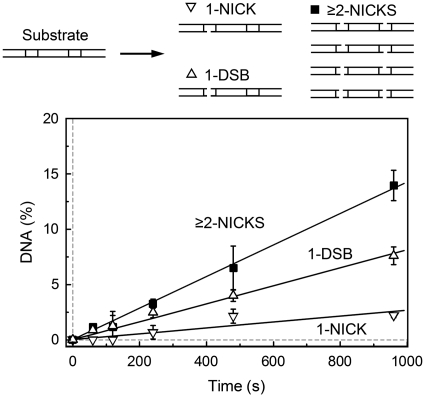
Figure 6.
Steady-state reactions on the two-site DNA. The reactions contained 1 nM BcnI and 100 nM of the two-site hairpin oligoduplex GG (Table 1). Changes in the relative amount of various DNA forms (schematically depicted above the graph) are shown: products with a single nick (‘1-NICK’, down triangles), products with one double-strand break (‘1-DSB’, up triangles) and the sum of products with two or more nicks at both recognition sites (‘≥2-NICKS’, filled squares). All data points are presented as mean values from three independent experiments ±1 SD. Linear regression (solid lines) was used to quantify the formation rates of ‘1-NICK’ (0.0027 ± 0.0005 nM s−1, 11% of all products), ‘1-DSB’ (0.0082 ± 0.0008 nM s−1, 32% of all products) and ‘≥2-NICKS’ (0.014 ± 0.002 nM s−1, 57% of all products).

