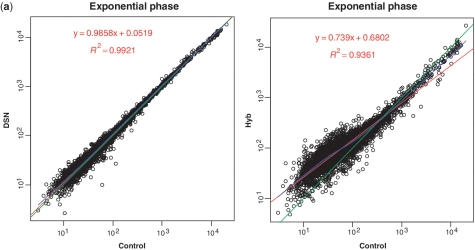
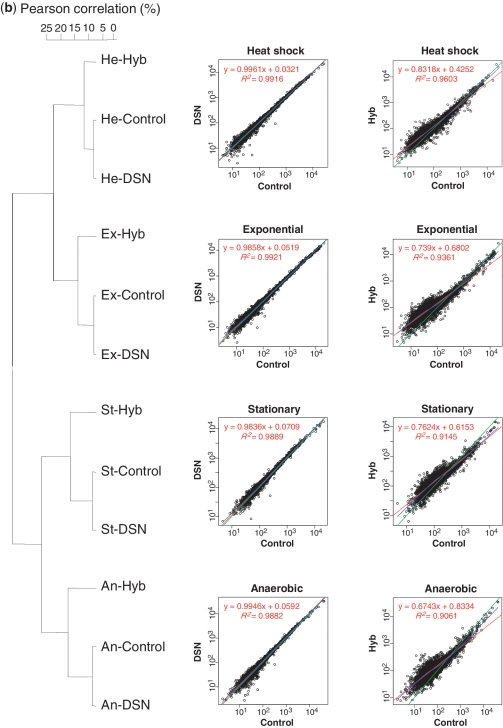
Figure 2.
Comparison of robustness of mRNA relative abundance using DSN and Hyb. (a) Correlation of relative gene expression between the control and rRNA removal treatments. The exponential phase libraries (Ex) are shown as an example. Left, control (Ex-C) versus DSN (Ex-D); right, control (Ex-C) versus Hyb (Ex-H). The points in the plot indicate the RPKM value of each individual mRNA transcript. Red indicates the linear regression line, and blue indicates non-linear regression (Lowess) fit. Green is a straight line with a slope of 1. (b) Hierarchical clustering of all samples tested in this study using UPGMA based on Pearson's correlation. The regression plot and dendrogram represent the superior conservation of mRNA relative abundance in DSN treatment compared to Hyb treatment.


