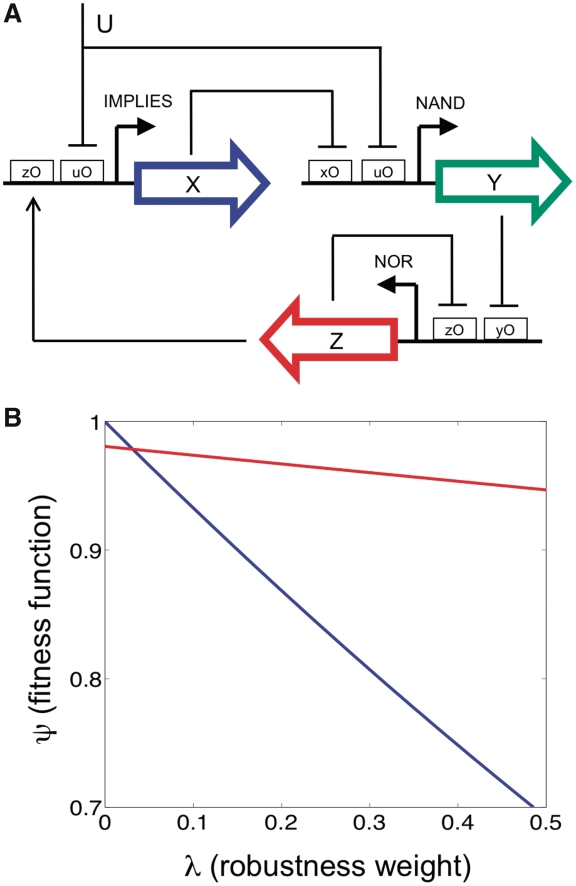
Figure 7.
(A) Scheme of a genetic circuit optimized to operate as a robust amplitude filter. U and Z are the input and output, respectively. (B) Fitness function versus the robustness weight for the robust circuit shown above (red) and the same circuit optimized with  (blue), illustrating the cost of robustness.

