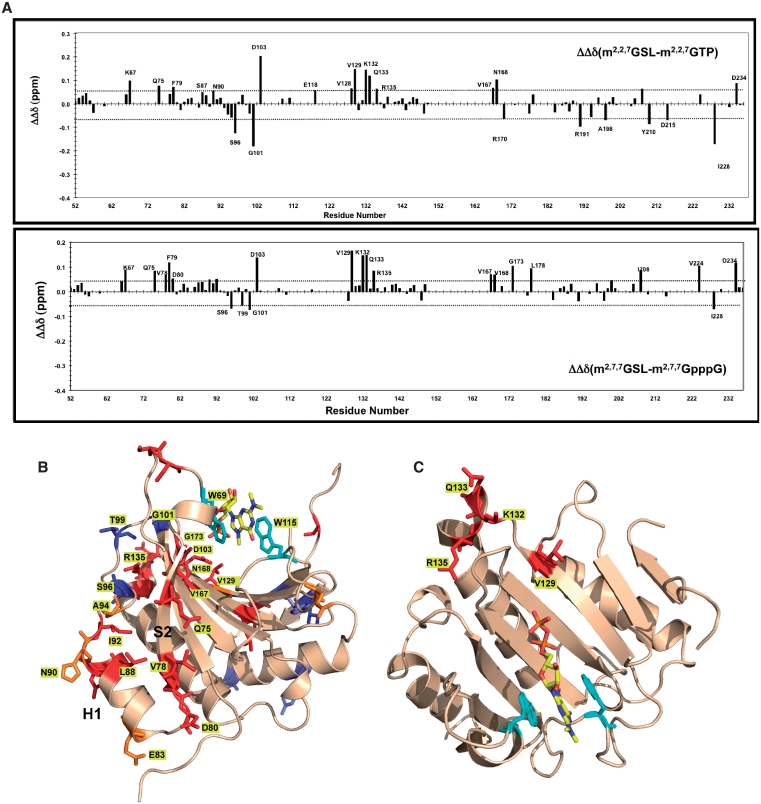
Figure 4.
Chemical shift changes on Ascaris eIF4E-3 binding m2,2,7G-spliced leader RNA increase changes at the eIF4E/G interface. (A) Chemical shift perturbations in eIF4E-3 on binding the m2,2,7G-spliced leader RNA compared to either m2,2,7GTP or m2,2,7GpppG. Determined as described in Figure 3A. The dashed horizontal lines represent ±1 SD from the mean chemical shift difference. Residues with significant chemical shifts are colored as follows: red = chemical shifts >1 SD above the mean and blue = residues with chemical shift changes <1 SD below the mean. Orange residues represent residues that show smaller differences when comparing m2,2,7GTP or m2,2,7GpppG. (B) Location of eIF4E-3 residues with different significant chemical shift perturbations on binding m2,2,7G-SL RNA compared to the m2,2,7G-cap. Residues with major chemical shifts are colored as follows: red = chemical shifts >1 SD above the mean and blue = residues with chemical shift changes <1 SD below the mean. Orange residues represent residues that show less increased shifts or differences when comparing m2,2,7GTP or m2,2,7GpppG. (C) Location of residues that exhibit increased chemical shift perturbations only in the presence of the 22-nt SL-RNA. These regions do not show chemical shift changes in the presence of triphosphate or dinucleotide cap analogs and most likely represents a region that interacts with the SL-RNA.

