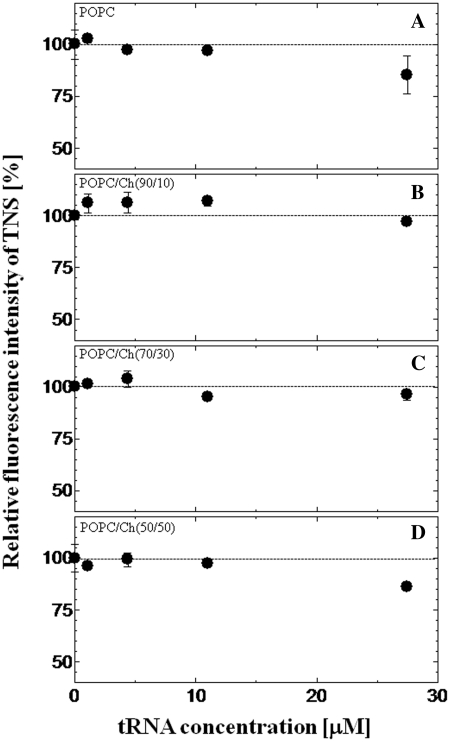
Figure 1.
Effect of tRNA on the relative fluorescence intensity of TNS with zwitterionic liposomes. TNS was excited at 340 nm, and the TNS emission peak was 446 nm for POPC (A), 444 nm for POPC/Ch(90/10) (B), 442 nm for POPC/Ch(70/30) (C) and 440 nm for POPC/Ch(50/50) (D). The dotted line shows the relative fluorescence intensity without tRNA. The final concentrations of lipids and TNS were 0.5 mM and 20 µM, respectively.

