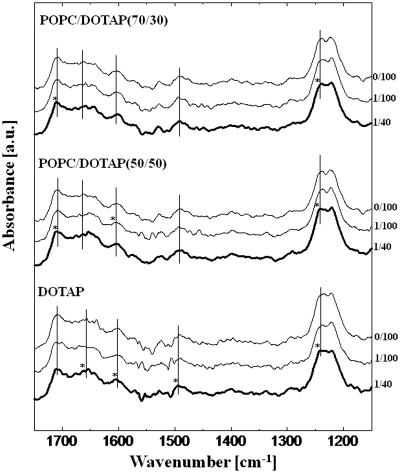
Figure 4.
FTIR spectra of tRNA in the presence of cationic liposomes. The molar ratios of lipd/tRNA were 0/100, 1/100 and 1/40. Axial bars indicating peak assignments of tRNA are shown in Table 3. Stars indicate significant peak shifts (>2.5 nm). The final concentration of tRNA and the lipid was 3.94 mM and 0–98.5 µM, respectively.

