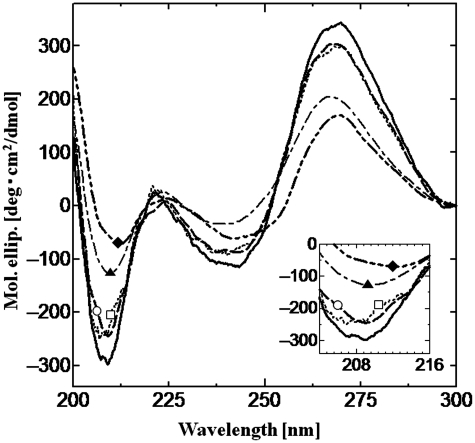
Figure 5.
CD spectra of tRNA in the presence of liposomes at 30°C. Black bold line only, tRNA without liposomes; dotted line (opened square), with POPC; dashed bold line (opened circle), with POPC/Ch(70/30); dot-dashed line (closed triangle), with POPC/DOTAP(70/30) and two dot-dashed bold line (closed diamond), with POPC/DOTAP(50/50). Final tRNA and lipid concentrations were 2.2 µM and 1.17 mM, respectively. Insert shows close-up spectra at around 208 nm.

