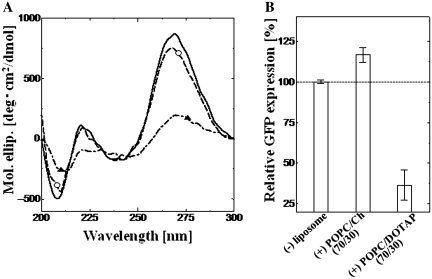
Figure 6.
Effect of liposomes on mRNA conformation and mRNA translational activity. (A) CD spectra are shown: black line only, mRNA without liposome; dashed line (opened circle), with POPC/Ch(70/30) and dot-dashed line (closed triangle), with POPC/DOTAP(70/30). Final mRNA and lipid concentrations were 0.77 µM and 1.17 mM, respectively. (B) GFP expression with and without liposomes. Final lipid concentration was 1.17 mM; GFP was expressed for 6 h at 30°C. The excitation and emission peaks of GFP were 395 and 509 nm, respectively.

