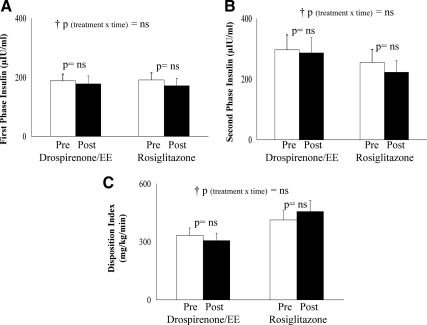
Fig. 4.
First- and second-phase insulin levels during the hyperglycemic clamp (A and B), and the disposition index (C), pre- and posttreatment in the drospirenone/EE and the rosiglitazone arms. p, Paired t test; †p, repeated-measures analysis (treatment × time) interaction, confirmed by intent-to-treat analysis. ns, Not significant.

