
FIG. 3.
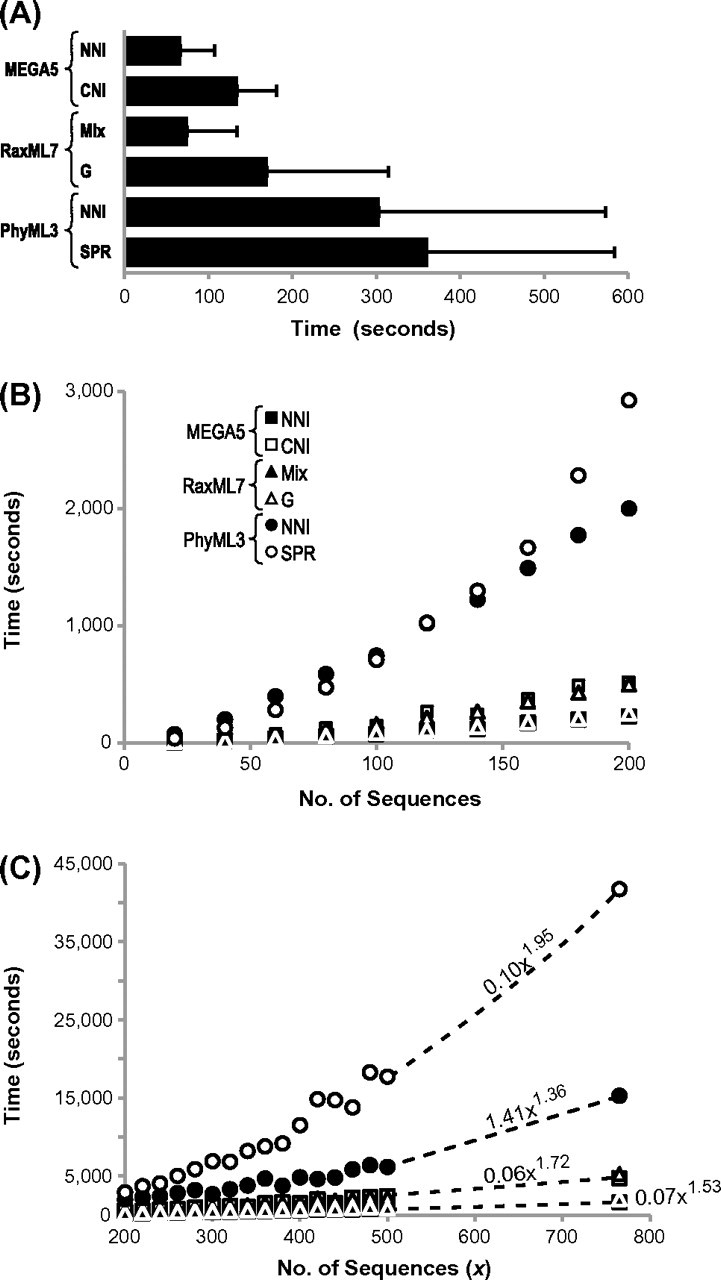
Comparison of the computational speed of ML heuristic searches. (A) Average time taken to complete MEGA5 (NNI and CNI), RaxML7 (G and MIX), and PhyML3 (NNI and SPR) heuristic searches for 1,792 simulated data sets containing 66 sequences each. Bars are shown with ±1 standard deviation. Three data sets were excluded from PhyML3 calculations, as the NNI search failed. (B, C) Scatter plots showing the time taken to search for the ML tree for alignments that contain 20–200 and 200–765 sequences of 2,000 base pairs. The power trend fits are indicated for PhyML3 and MEGA5 (r2 > 0.98 in all cases). For direct comparisons, all analyses were conducted by using 4 discrete categories for the Gamma distribution and a GTR model of nucleotide substitution (see Materials and Methods for simulation procedures, analysis descriptions, and computer hardware used). G, GTRGAMMA with four discrete Gamma categories; MIX, mixed method of using CAT and GAMMA models.