
Figure 5.
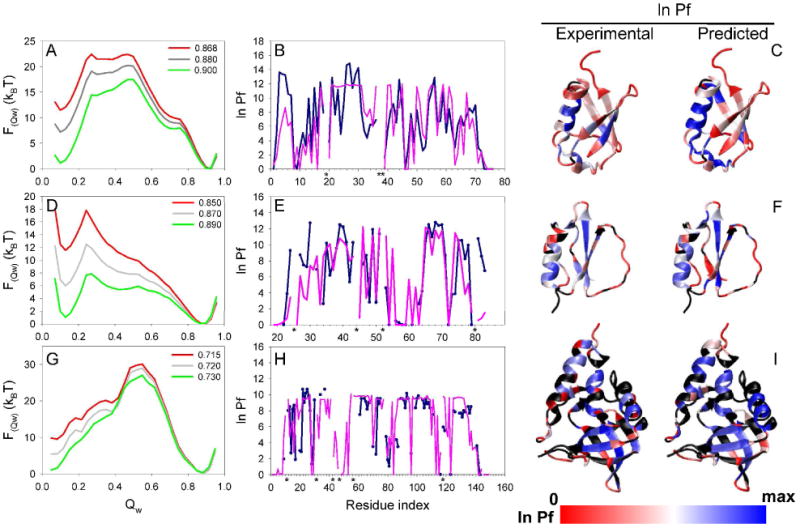
Simulated and experimental properties of ubiquitin (panels A-C), CI2 (panels D-E), and SN (panels G-I). The first column shows the free energy as a function of the global reaction coordinate Qw derived from the simulations of each protein at the Tf and extrapolated to different temperatures (green line is the sampling temperature whereas the red line represents the extrapolated experimental temperature). The plots in the second column show the comparison of the experimental (blue line) and predicted (purple line) HX patterns for each protein at the experimental temperature. Proline residues are labeled with a black asterisk. The third column shows the structure of each protein colored by the value of the experimental and predicted ln Pf (blue: high protection, white: medium protection, red: low or no protection. The residues colored in black represents the ones with not reported experimental Pf. Sampling was carried out at or near the Tf, and the results were extrapolated to the experimental temperature (Simulation temperature|Extrapolated temperature in reduced units: 0.900|0.868, 0.890|0.850, and 0.730|0.715, for ubiquitin, CI2, and SN, respectively). Calculation of the predicted protection factor was done as described in Methods using the combined accessibility and H-bonding criteria. The analysis corresponds to the same simulations as the ones presented in Figure 4.